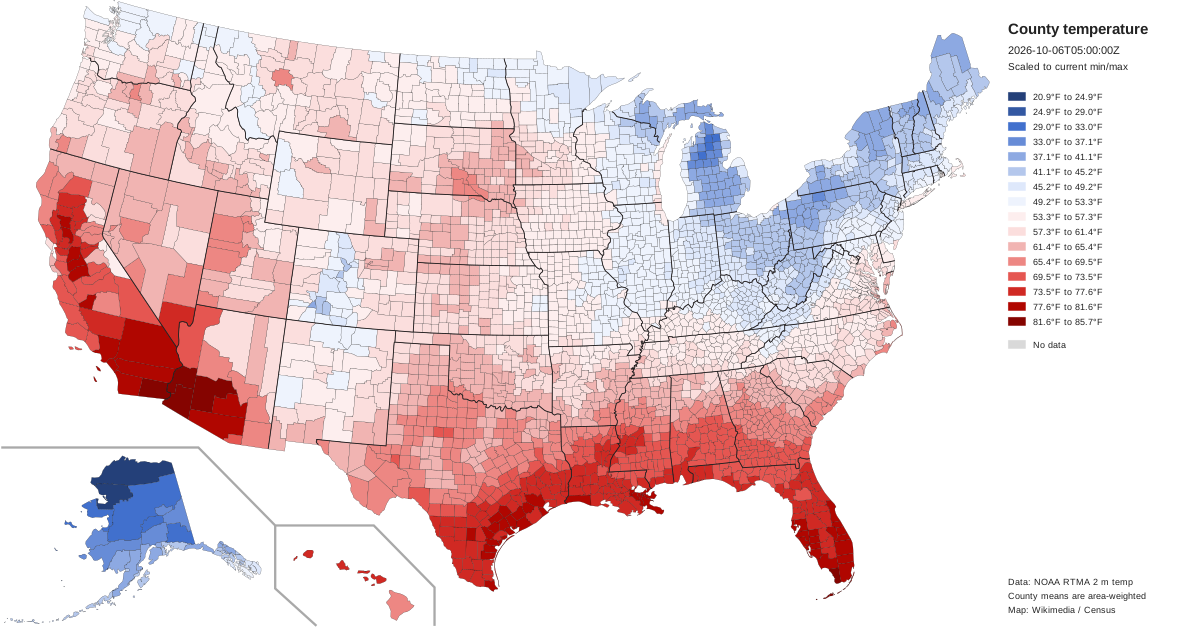
The temperature of every county in the contiguous United States, painted from the latest NOAA RTMA hour. The map and the numbers below repaint every three hours. The interactive version, with hourly series, precipitation, wind and humidity, lives on the full dashboard.
| National mean | Coldest | Hottest | Map hour (UTC) |
|---|---|---|---|
| — | — | — | — |
| Hottest counties | °F | Coldest counties | °F | |
|---|---|---|---|---|
| 1 | — | — | — | — |
| 2 | — | — | — | — |
| 3 | — | — | — | — |